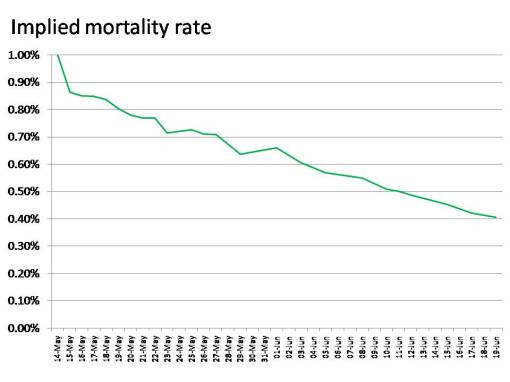
As we get more data in, the implied mortality rate of this virus continues to fall. Since I last did this graph (as at 7 days ago) the implied mortality rate has fallen 0.08% to 0.41%. That’s over a 16% reduction in a week. For a full discussion on what I mean by “implied mortality rates”, including an explanation about why a falling “implied mortality rate” does not necessarily mean the virus is getting weaker, refer here.
Implied mortality rate continues to fall – updated graph
20 06 2009Comments : Leave a Comment »
Categories : swine flu, swine flu graphs, swine flu mortality rate
First Australian death
20 06 2009Information on the first person to die with Swine Flu in Australia:
Note that the ABC is quoting the Australian Health Minister as saying:
“Whilst this is the first recorded death in Australia of a person who had swine flu, it is unclear whether that was a direct or contributing cause to the death,” …
The person apparently had other health issues.
Comments : Leave a Comment »
Categories : swine flu, swine flu Australia
Large global increase – 19th June
20 06 2009WHO’s latest update (update 51 as at 19th June) shows another large jump (4,667 in under two days). I’ve updated the global graphs at the top of this blog so you can get a sense of its size. I’ve also managed to update the Australian graphs to 19th June. And I’ve taken Vic’s suggestion and made the scales the same on each type of the Australian graphs for the whole country and for the country excluding Victoria. Let me know what you think.
Comments : Leave a Comment »
Categories : swine flu, swine flu Australia, swine flu graphs
