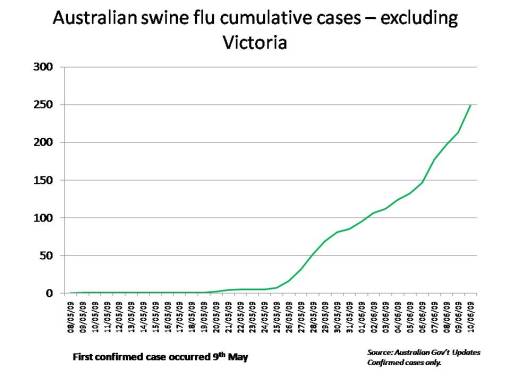
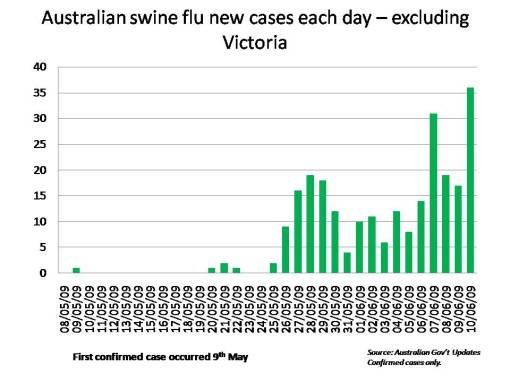
I’ve stripped out Victoria from the numbers of new cases and cumulative cases and then recut the graphs (see below). I’ve stripped out Victoria for two reasons:
- Firstly, they’ve stopped reporting regularly, so I’m pissed.
- Secondly, the large absolute number makes it very hard to see the trends in the other states of Australia.
So, the first graph (below) shows the cumulative number of cases of swine flu in Australia excluding Victoria.
The second graph – which is very interesting – shows the number of new cases reported in Australia (ex Vic) each day. And what it shows is that today we’ve seen the highest number of new cases in Australia yet (not counting Vic). In other words, the virus seems to be getting the foothold in the rest of the country that we all expected it would.
(PS – I’ve updated the Australian total graphs at the top of the blog as usual – but they’re getting less interesting).


Nick,
I took the liberty of highlighting your blog entry today on my site, along with a strong recommendation that people add your blog to their daily rounds.
As always, very nice job on the graphs.
Regards,
Mike at Avian Flu Diary
Thanks Mike so much – I really appreciate it. Your site at avianfludiary is great – and to get refferals from it is just fantastic. Cheers. Nick.